Think of the thousands of photos on your computer, gigs of music etc… You’re not the only one, businesses and the government generate massive quantities of data such as statistics or financial information. Information visualization is a new way of tackling the massive stream of data that is produced on a daily basis.
To see some interesting examples, you can check David McCandless’ site at http://informationisbeautiful.net
Since I love photography, I am interested in being able to visualize the data associated with photography. So many software engineers are also avid photographers and so much data (exif, tagging, geodata) but surprisingly, there is not much visualization work available in the field of photography.
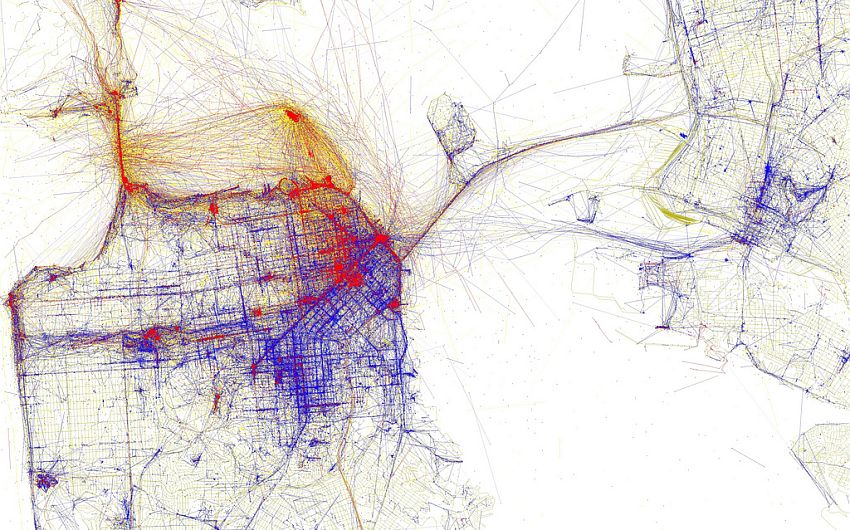
However I found one that I quite like from Eric Fischer. It’s a visualization of local and tourist photo geodata using the Flickr API. The blue marks represent photos taken by locals, the red marks by tourists. Here’s the full version for San Diego.

As you can see, the major tourist destinations in the city are Balboa Park, the Zoo, downtown, the Gaslamp quarter, Coronado and SeaWorld. You’d expect the local data to point out secret, cool, sightseeing spots that only locals know about. But what I noticed is that it actually shows you the best places to hit the bars, University St. between Hillcrest and 30th, Adams Ave., Newport St. in Ocean Beach and Garnet St. in Pacific Beach.
If you think about it, most people are most likely to take photos when out with friends at a bar. In fact, looking closely at South Park, where I live, the one dense blue dot on the map clearly points at Juniper and 30th, the location of the Whistlestop Bar, Station Tavern and Burgers and Rose Wine Pub.
How cool is that? In a new city, you could use the red areas to decide what to do during the day, and the blue areas to find the best nightlife. This sort of unexpected information becoming apparent is the best part of information visualization.
Some of these patterns might become more obvious if this map were animating the data over time. Animated over a day, you’d be able to see the blue marks light up at night and make that relationship more obvious. Animated over a year, you could see the best times to visit (or more likely, avoid!) the major tourist destinations.
To see a wonderful TED talk on information visualization, check out David McCandless’ talk.
this is such a cool way to look at photo data! great food for thought when considering multiple ways to find trends in data. oh yeah, I checked out the site, and it’s informationisbeautiful.net, not .com, fyi
i am really liking the blog!
Thanks Tiffany, just starting out so thanks for the feedback! I’ll fix the link.
Thanks Adrienne, that’s kind of the area of computer science that I’m interested in – how to make technology be beautiful and comfortable and usable by humans.